.jpeg)
Sales key performance indicators (KPIs) are the handful of specific, measurable values that tell you if your sales strategy is actually working. Think of them as the most critical gauges on a car's dashboard—speed, fuel level, engine temperature. While there are dozens of other readings, these are the ones that tell you if you're on track to reach your destination safely. KPIs do the same for your business goals, turning raw data into real intelligence.
Understanding Key Performance Indicators in Sales

So, what are KPIs in sales, really? They're the vital signs of your sales operation. A healthy business tracks all sorts of numbers, but only a select few earn the title of key performance indicator. That's because a true KPI is directly tied to a critical business objective, like boosting quarterly revenue or capturing more market share.
This distinction is everything. For instance, the total number of cold calls your team makes in a month is a metric. It's a number, sure, but it doesn't tell you much on its own. But the conversion rate from those calls into qualified meetings? That's a powerful KPI. It measures how effective that activity is at achieving the real goal: building a pipeline full of solid opportunities.
The Difference Between a Metric and a KPI
It's easy to get sales metrics and sales KPIs mixed up, but knowing the difference is fundamental. A metric simply measures an activity, while a KPI measures the impact of that activity on a specific goal.
Let’s put it this way:
- Metrics are informational. They tell you what happened (e.g., “We made 1,000 cold calls this month.”).
- KPIs are performance-based. They tell you if what happened is actually moving the needle (e.g., “Our call-to-meeting conversion rate is 5%, putting us on track for our goal of 50 new meetings.”).
People often use these terms interchangeably, but they shouldn't. To clarify, here’s a quick breakdown of how they stack up against each other.
Key Differences Between Sales Metrics and Sales KPIs
Ultimately, focusing on the right KPIs helps your team sidestep "vanity metrics"—those numbers that look impressive on a slide but don’t actually contribute to the bottom line.
A key performance indicator is a metric that’s been promoted. It’s been given a specific job: to measure strategic success, not just operational noise.
Why Every Sales Team Needs KPIs
Without clear sales performance indicators, your team is flying blind. They're just guessing. There’s no shared definition of success, no clear benchmark for improvement, and no way to know what’s working and what’s not.
Good sales KPIs bring focus. They align everyone's efforts on the things that truly matter and empower you to make data-driven decisions that get consistent results. For a deeper dive, check out our glossary entry on key performance indicators.
Throughout this guide, we'll walk through specific examples of key performance indicators in sales, showing you how to pick them, track them, and act on them to drive sustainable growth.
Why Tracking Sales Performance Is Crucial
Keeping a close eye on your sales performance indicators isn't just about putting together reports for the higher-ups. It's about building a predictable, scalable revenue machine. A sales culture built on transparent sales KPIs gives your team a clear sense of purpose and direction. When everyone knows the score, they know exactly how to win.
Monitoring these numbers is the difference between reacting to problems and proactively shaping your strategy. It lets you forecast revenue more accurately, spot coaching opportunities before a small slump becomes a big problem, and get the whole sales org pulling in the same direction. The conversation shifts from just "sell more" to a deep understanding of how and why deals actually happen.
Turning Data Into Action
Picture this: a key metric like your "Lead-to-Opportunity Conversion Rate" suddenly nosedives by 15% and stays there for two straight weeks. If you aren't tracking it, you might not catch this until the end of the quarter when you're staring at a huge revenue gap.
With consistent KPI monitoring, a sales manager spots that trend the moment it starts. The KPI becomes a diagnostic tool, sparking critical questions:
- Is something off with lead quality? Maybe a new marketing campaign is bringing in a ton of folks who aren't a good fit.
- Does our script need a tune-up? Reps might be struggling to connect the dots for prospects on those first calls.
- Did a competitor just make a move? A rival's new feature or price cut could be throwing a wrench in early-stage conversations.
This is what turning data into a tool for constant improvement looks like. The data itself doesn't hand you the solution, but it shines a massive spotlight on exactly where you need to look. For some hands-on advice, check out these 7 tips to improve sales performance.
Fostering a Culture of Accountability and Improvement
When the key performance indicators sales teams live by are out in the open for everyone to see, it creates a healthy, accountable environment. Reps can see their own performance against team goals and benchmarks, which gives them real ownership over their results. This isn't about micromanagement; it's about empowerment.
By making performance data accessible, you equip your team with the same insights leadership uses. This builds trust and encourages individual reps to self-correct and seek out coaching when they see their numbers slipping.
Suddenly, sales meetings transform from subjective chats based on gut feelings into productive, evidence-based strategy sessions. Instead of guessing, your team can break down what’s actually working, double down on successful tactics, and fix weaknesses with targeted training. Knowing how to analyze sales data is a game-changing skill for any sales leader trying to build a top-tier team.
Ultimately, tracking the right sales metrics KPI data creates a powerful feedback loop for non-stop optimization. It ensures that every single activity—from the first cold call to the final signature—is measured, understood, and refined to drive better results and real, sustainable growth.
Top of Funnel KPIs for Prospecting

A healthy sales pipeline is a lot like a powerful river—it needs to be fed by a constant flow of streams at its source. For sales teams, those streams are your prospecting and lead generation efforts. This is the very top of your funnel, where you make first contact and see if there's any interest.
Keeping a close eye on the right sales KPIs here isn't just a good idea; it’s absolutely critical. It’s the only way to guarantee a steady flow of quality opportunities makes its way downstream.
These top-of-funnel metrics are all about speed, volume, and quality. They tell you how good you are at finding potential customers and pulling them into the first stages of your sales process. If you don't have a solid grip on these numbers, your pipeline can dry up out of nowhere, leaving your team scrambling to hit their numbers.
Let's dive into the essential sales metrics that really measure prospecting success.
Lead Response Time
Ever ordered a pizza and been told it’ll be there in ten minutes versus two hours? That feeling of excitement is worlds apart. Lead Response Time is the sales version of pizza delivery speed—it's the average time it takes a rep to follow up after an inbound lead shows interest.
In sales, speed is king. Seriously. Studies show that contacting a lead within five minutes of them reaching out can massively increase your chances of converting them. A slow response doesn't just let a lead's interest fade; it swings the door wide open for your competitors.
- What it reveals: How urgent your team is and how efficient your lead routing system is.
- How to calculate it:
Total Time Taken to Respond to Leads / Total Number of Leads Responded To - Industry Benchmark: For inbound leads, you should be aiming for under 5 minutes. No excuses.
Marketing Qualified Leads (MQLs)
Let's be real: not every person who downloads your latest whitepaper is ready to buy. A Marketing Qualified Lead (MQL) is someone who has interacted with your marketing in a way that signals they're more likely to become a customer than the average Joe.
MQLs are flagged based on specific actions, like checking out your pricing page, asking for a demo, or opening every email you send. Tracking MQLs is crucial for getting marketing and sales on the same page, making sure the sales team puts their energy into prospects who’ve already put their hand up.
Think of an MQL as a signal flare from marketing to sales that says, "Hey, this one is worth your time." It’s the official handoff that kicks off the sales journey for a promising prospect.
Sales Qualified Leads (SQLs)
Once marketing passes over an MQL, it's sales' turn to see if there's real potential. A Sales Qualified Lead (SQL) is an MQL that the sales team has vetted and confirmed is a legitimate prospect who deserves a direct follow-up.
This qualification step is where you separate the wheat from the chaff. It stops reps from wasting cycles on leads who don't have the budget, authority, or a real need for your product. To get this right, sales teams use all kinds of sales prospecting methods to dig deeper and confirm that a prospect is the real deal.
Lead-to-Opportunity Conversion Rate
This is where the rubber meets the road. Your Lead-to-Opportunity Conversion Rate tracks the percentage of leads that actually turn into a formal sales opportunity in your pipeline. It’s a direct reflection of how effective your team is at the very start of the sales cycle.
A low number here can point to a few different problems. Maybe the lead quality from marketing is poor. Maybe the sales team's initial outreach is falling flat. Or maybe there's a disconnect between what marketing is promising and what sales is delivering. Nailing this sales performance indicator helps you find and fix bottlenecks right at the entrance of your funnel, filling it with real, viable deals instead of just a bunch of dead-end leads.
Core KPIs for Managing Your Sales Pipeline
Once a prospect makes the leap from "interested" to a real, qualified opportunity, they enter your sales pipeline. This is where the magic happens—it’s the critical stretch where deals are nurtured, negotiated, and ultimately won or lost. To get this right, you need a laser focus on the sales performance indicators that track momentum, efficiency, and the overall health of your deal flow.
Think of your sales pipeline like a highway. Your top-of-funnel KPIs are responsible for getting a steady stream of cars onto the on-ramp. But these mid-funnel sales KPIs tell you how fast those cars are moving, if there are any traffic jams, and how many are actually reaching their destination. Flying blind here is like hoping for the best on a holiday weekend—you’re just asking for bottlenecks and delays.
These metrics give you a real-time pulse on your sales engine. They help you spot problems long before they have a chance to derail your entire quarter. Let's dig into the essential key performance indicators sales teams must watch to keep their pipelines moving.
Sales Cycle Length
Your Sales Cycle Length is simply the average time it takes for a deal to go from that first "hello" to a signed contract. It's a blunt but effective measure of your sales process's efficiency. A shorter cycle usually means your team is closing faster, which translates to quicker revenue and a more predictable forecast.
But hold on—a long sales cycle isn't automatically a red flag. If you're seeing a lengthy cycle paired with a high average deal size, it might just mean your team is navigating complex, high-value deals. Those naturally take more time and involve more decision-makers. The trick is to understand the story behind the number.
- What It Measures: The speed and efficiency of your entire sales process.
- How to Calculate It:
Total Number of Days to Close All Deals / Total Number of Deals Won - Why It Matters: Keeping an eye on this KPI helps you pinpoint stages where deals get stuck. Armed with that knowledge, you can refine your process or provide targeted coaching. For a full guide on setting up these stages, check out our piece on how to build a sales pipeline that promotes a smooth deal flow.
Pipeline Value
Pipeline Value is the total potential revenue of all the open opportunities you're currently working. Think of this sales metrics kpi as a high-level forecast of your future earnings potential. It’s one of the most important leading indicators for the quarters ahead.
As a rule of thumb, a healthy pipeline value should be several times your sales quota. Why? Because you have to account for the deals that will inevitably fall through or get pushed back. If your pipeline value is consistently low, that’s a loud and clear signal that your top-of-funnel prospecting needs a serious boost.
Pipeline Value isn't just a number; it’s a measure of your sales team's future opportunities. A robust pipeline gives you the confidence and runway to hit long-term revenue targets.
Win Rate
If you have to pick just one, this might be it. As one of the most critical examples of key performance indicators in sales, your Win Rate tells you what percentage of closed opportunities your team actually wins. This is the ultimate litmus test for your sales team’s effectiveness, your product’s appeal, and your company's overall market fit.
A high win rate is a great sign—it means your team is clicking with the right customer profiles and knows how to close. On the flip side, a low win rate can point to issues with your sales process, pricing, product, or even how you stack up against the competition.
Take a look at the chart below. It's a great example of how a team might track their key metrics over time.
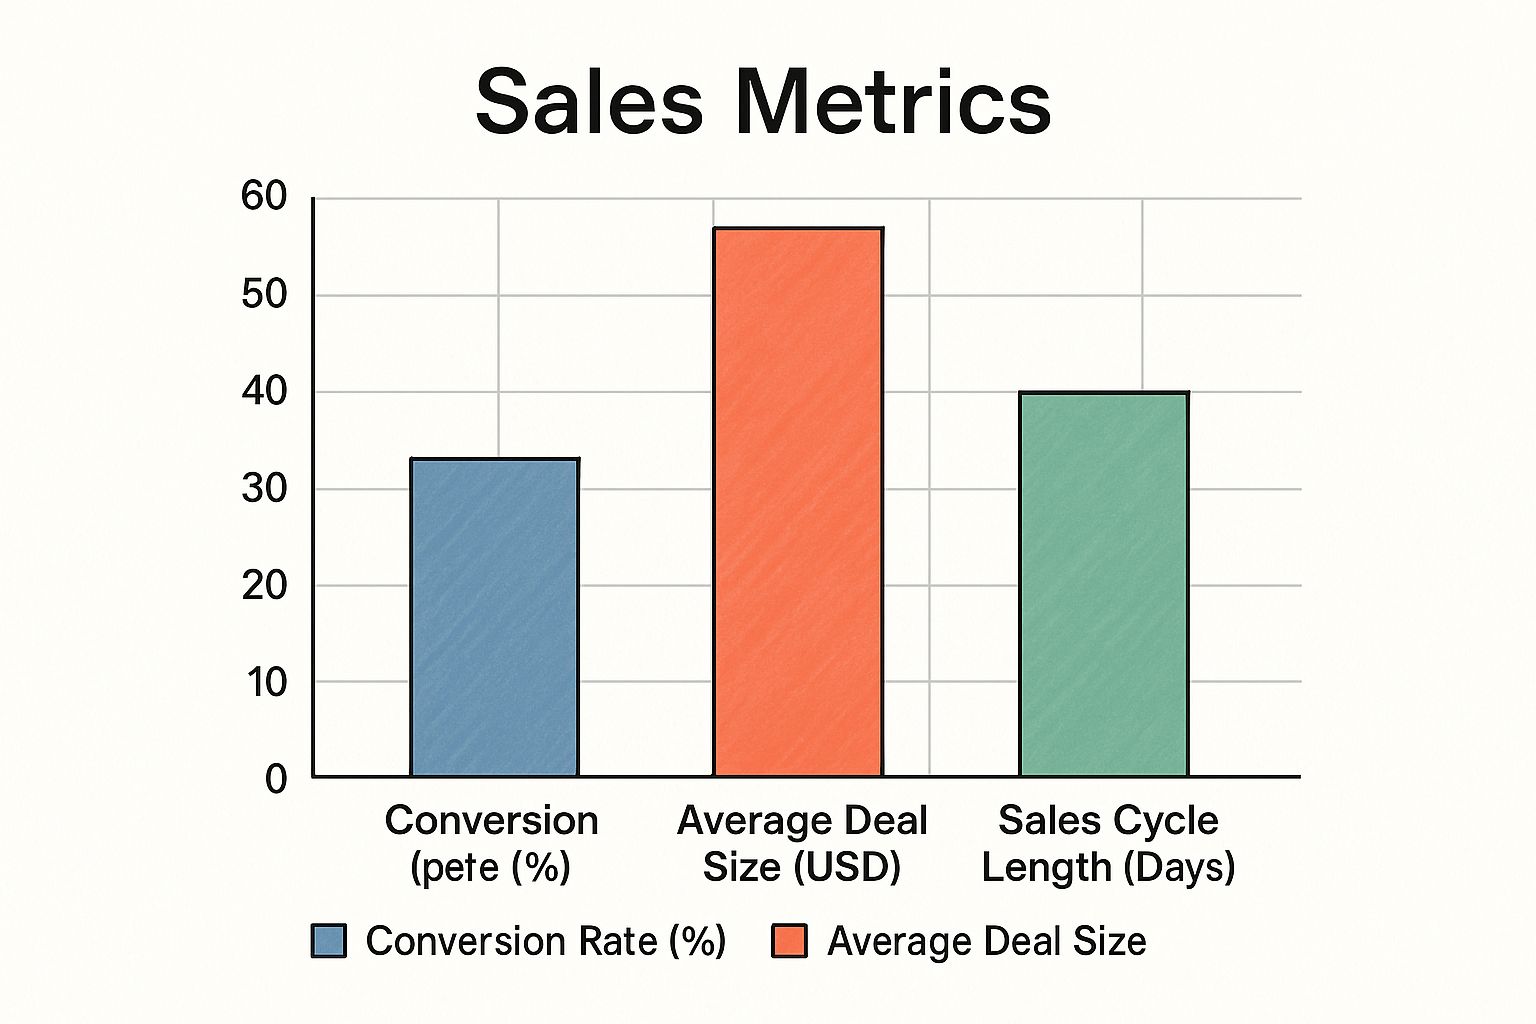
This visual shows a positive trend. The conversion rate and average deal size are climbing while the sales cycle stays consistent—a clear sign of growing efficiency and effectiveness.
Another crucial sales key performance indicator (KPI) is the win rate itself, which is the percentage of deals won out of all closed opportunities (both won and lost). For most B2B sales teams, a healthy benchmark is in the 20% to 30% range. This means winning about 2 to 3 deals for every 10 that reach a final decision. You can calculate it by dividing the number of deals won by the total deals closed, then multiplying by 100. For more industry benchmarks, Forecast.io is a great resource.
Top Pipeline Management KPIs Explained
To help you keep these straight, here's a quick summary of the pipeline KPIs we've covered.
These three metrics provide a foundational view of your pipeline's health. Tracking them consistently will give you the insights needed to make smarter decisions, coach your team effectively, and ultimately, drive more revenue.
KPIs That Measure Financial and Business Impact

Hitting your quota is one thing, but driving truly profitable growth is a whole different ballgame. The most strategic sales key performance indicators are the ones that connect your team's day-to-day grind directly to the company's financial health. While pipeline metrics tell you how busy your team is, these financial KPIs tell you if all that activity is actually making the business stronger.
These are the numbers that your CEO and CFO lose sleep over. They shift the conversation from deal counts and win rates to the real heart of the business: sustainability and profit. When you master these sales performance indicators, you go from being a team manager to a strategic partner who can clearly show the bottom-line value your team creates.
Customer Acquisition Cost (CAC)
First up is one of the most critical financial sales kpis: Customer Acquisition Cost, or CAC.
Think of it as the total price tag for winning a new customer. It’s not just about sales commissions. It’s the full investment—from the money spent on marketing campaigns to sales salaries—that it takes to get that signature on the dotted line.
A low CAC is a sign of an efficient, well-oiled sales and marketing machine. A high or rising CAC, on the other hand, is a huge red flag. It means you’re spending too much to grow, which can chew through your profits even if revenue is climbing. For a deeper dive into important business metrics, check out this post from The Accounting Department's blog.
Customer Lifetime Value (LTV)
While CAC tells you the cost to get a customer in the door, Customer Lifetime Value (LTV) looks at the bigger picture. It predicts the total revenue you can expect from that customer over their entire relationship with your company. It’s a powerful forecasting metric that pulls the focus away from a single sale and toward long-term value.
A high LTV is a fantastic sign. It means you have a sticky product and happy customers who keep coming back for more. It's a crucial piece of the financial puzzle because, without it, you have no idea how much you should be spending to acquire customers in the first place.
LTV is the ultimate reward for a great product and a strong customer relationship. It answers the question, "What is a customer truly worth to us over the long haul?"
The Golden Ratio: LTV to CAC
On their own, LTV and CAC are powerful examples of key performance indicators in sales. But when you put them together, they create the single most important ratio for judging the health and scalability of your business. The LTV:CAC ratio shows you exactly how much return you’re getting for every dollar you spend acquiring customers.
Here's a quick cheat sheet for what this crucial sales metrics kpi means:
- 1:1 Ratio: Big trouble. You’re essentially losing money on every new customer. Your model is broken and unsustainable.
- 3:1 Ratio: This is widely seen as the gold standard. You’re generating healthy, profitable growth and have a scalable model.
- 5:1 Ratio or Higher: This sounds great—and it is—but it might also signal that you’re underinvesting in sales and marketing. You could be leaving money on the table and giving competitors an opening to grow faster.
For any sales leader focused on sustainable growth, tracking this ratio is non-negotiable. It gives you a clear, data-driven answer to the question, "Is our growth strategy actually profitable?" Knowing this helps you make much smarter calls on where to invest your team's time and the company's money.
How to Effectively Track Your Sales KPIs
Knowing which sales key performance indicators to watch is only half the battle. The real magic happens when you build a consistent and effective way to track them. This is how you turn abstract goals into a practical, data-driven operation that steers your team’s daily efforts and big-picture strategy.
But let's be clear: tracking sales KPIs effectively isn't about drowning your team in spreadsheets. It's about creating a clean, accessible dashboard that tells the story of your performance. The goal is to make data an ally, not a burden, so everyone from reps to sales leaders can see exactly how their work connects to the bottom line.
Choosing the Right KPIs for Your Business
First things first: you need to pick the KPIs that actually align with your business goals. Don't just pull a generic list off the internet. A startup trying to grab market share will obsess over different key performance indicators sales metrics (like New Leads and Customer Acquisition Cost) than an established company focusing on profitability (which will lean on Customer Lifetime Value and Average Deal Size).
Start with a simple question: "What does a win look like for us this quarter?" Answering that will immediately help you filter out the noise and lock in on the handful of sales performance indicators that truly matter. For a more detailed look at the mechanics, you might want to learn how to track sales effectively.
Setting Up Your Sales Dashboard
Your CRM should be the command center for your sales KPIs. A well-designed dashboard gives you a real-time, visual pulse on performance, cutting out the soul-crushing task of pulling data manually. It's your single source of truth, keeping everyone on the same page.
When you're building it, think "less is more." Don't clutter the screen with dozens of metrics. Instead, shine a spotlight on the vital few that tie directly back to your main goals. Using strong visuals like charts and gauges can make even complex data dead simple to understand at a glance. We cover more on this in our guide to essential CRM reports for making smarter decisions.
A great sales dashboard doesn't just display data; it answers critical business questions. It should immediately tell you if you're on track, where you're falling behind, and which areas need immediate attention.
Fostering Team Buy-In and Motivation
This is the final—and maybe most important—step. You have to get your team to understand the "why" behind each KPI. Your reps will be far more motivated to improve a metric like Sales Cycle Length when they see how it helps them close deals faster and smash their targets.
Position your KPIs as tools for success, not instruments for micromanagement. They should be the foundation for coaching conversations and a way to celebrate wins, big and small. When your team views their KPIs as a roadmap to hitting their own goals, you create a powerful culture of accountability and constant improvement. That's how tracking transforms from a simple reporting task into the engine that drives your entire sales machine.
Got Questions About Sales KPIs? We've Got Answers.
Even after you've got the basics down, a few questions always pop up when it's time to actually put sales key performance indicators to work. Let's tackle some of the most common ones to clear up any confusion and help you sharpen your approach.
What Are the 5 Key Performance Indicators in Sales?
While every business is a little different, there's a core group of five that gives you a fantastic, well-rounded view of your sales performance. Think of these as the essential gauges on your sales engine's dashboard, covering everything from the quality of your leads to the money in the bank.
So, what are the 5 key performance indicators in sales you should probably be tracking?
- Win Rate: Simple and powerful. This shows how effective you are at closing deals.
- Sales Cycle Length: This tells you how efficient your process is. Are deals flying through or getting stuck?
- Customer Acquisition Cost (CAC): This is all about profitability. How much are you spending to bring in each new customer?
- Lead-to-Opportunity Conversion Rate: This measures how good your initial lead quality is and how well your team engages new prospects.
- Quota Attainment: The classic report card. This tracks how your team and individual reps are performing against their goals.
Leading vs. Lagging Sales KPIs
Getting your head around the difference between leading and lagging sales performance indicators is a game-changer for smart planning. One helps you predict the future, while the other confirms what happened in the past.
Leading indicators are forward-looking metrics that track the activities driving future results. Think: number of demos booked this week. Lagging indicators are backward-looking metrics that measure past results, like your total revenue last quarter.
You absolutely need both on your dashboard. Leading indicators are your early warning system, telling you if you're on track to hit your targets. Lagging indicators are the final score, confirming whether you actually crossed the finish line.
How Often Should You Review Sales KPIs?
The right rhythm for checking your numbers really depends on the specific sales metrics KPI. You wouldn't check your blood pressure every five minutes, right? Same idea here.
Activity-based metrics like calls made or emails sent are perfect for a quick daily or weekly check-in. Core pipeline health metrics like Win Rate deserve a spot in your weekly or bi-weekly sales meetings.
Then you have the big-picture, strategic stuff like CAC. Those are usually reviewed monthly or quarterly by leadership to steer the entire business strategy.
Ready to supercharge your outreach and fill your pipeline with qualified leads? PlusVibe uses AI to create hyper-personalized cold email campaigns that hit the inbox and get replies. Start scaling your outreach with PlusVibe today!